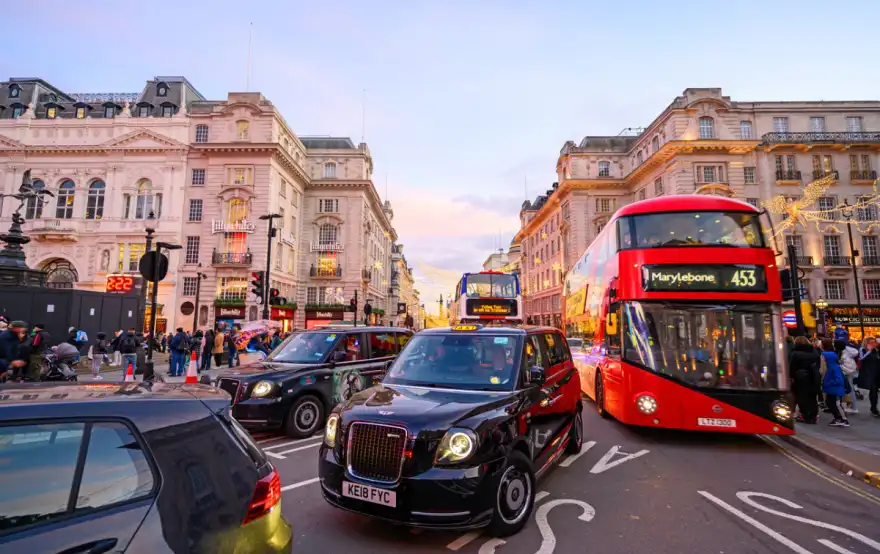
If you thought sitting in traffic was just a bad day, try spending over 100 hours stuck in it. That was the reality for drivers in London last year, as the city claimed the title of the most congested in Europe, according to a report by transport analytics company Inrix.
MOST CONGESTED UK CITIES WHERE DRIVERS EXPERIENCE WORST TRAFFIC
| 2024 U.K. Rank (2023 Rank) | Urban Area | 2024 Hours Lost (2023 Hours Lost) | Delay Change | 2024 Cost per Driver | 2024 Cost per City | Downtown Speed (mph) |
|---|---|---|---|---|---|---|
| 1 (1) | London | 101 (99) | 2% | £942 | £ 3.85 B | 13 |
| 2 (3) | Bristol | 65 (62) | 5% | £606 | £ 125 M | 17 |
| 3 (4) | Leeds | 60 (59) | 2% | £560 | £ 204 M | 19 |
| 4 (8) | Manchester | 61 (54) | 13% | £570 | £ 129 M | 17 |
| 5 (6) | Bath | 68 (67) | 1% | £634 | £ 26 M | 15 |
| 6 (2) | Birmingham | 54 (60) | -10% | £504 | £ 300 M | 20 |
| 7 (5) | Wigan | 57 (61) | -7% | £532 | £ 87 M | 18 |
| 8 (7) | Chelmsford | 59 (60) | -2% | £550 | £ 46 M | 22 |
| 9 (11) | Sheffield | 53 (52) | 2% | £494 | £ 133 M | 18 |
Drivers in the capital lost an average of 101 hours to traffic in 2024—a 2% rise from the previous year. This gridlock came with a hefty price tag, costing London a staggering £3.85 billion, or around £942 per driver.
Paris wasn’t far behind, with drivers there clocking up 97 hours of delays, followed by Dublin at 81 hours. Globally, London ranked fifth in congestion, with Istanbul taking the (unwanted) top spot.
MOST CONGESTED CITIES IN THE WORLD IN 2024
| 2024 Impact Rank (2023 Rank) | Urban Area | Country | 2024 Delay per Driver (hours) | 2023 Delay per Driver (hours) | Change from 2023 | Downtown Speed (mph) |
|---|---|---|---|---|---|---|
| 1 (6) | Istanbul | TUR | 105 | 91 | 15% | 15 |
| 2 (1) | New York City NY | USA | 102 | 101 | 1% | 13 |
| 3 (5) | Chicago IL | USA | 102 | 96 | 6% | 14 |
| 4 (2) | Mexico City | MEX | 97 | 96 | 1% | 13 |
| 5 (3) | London | GBR | 101 | 99 | 2% | 13 |
| 6 (4) | Paris | FRA | 97 | 97 | 0% | 13 |
| 7 (10) | Jakarta | IDN | 89 | 65 | 37% | 13 |
| 8 (7) | Los Angeles CA | USA | 88 | 89 | -1% | 22 |
| 9 (9) | Cape Town | ZAF | 94 | 83 | 13% | 14 |
| 10 (12) | Brisbane | AUS | 84 | 74 | 14% | 21 |
| 11 (14) | Bangkok | THA | 74 | 63 | 17% | 16 |
| 12 (8) | Boston MA | USA | 79 | 88 | -10% | 13 |
| 13 (13) | Philadelphia PA | USA | 77 | 69 | 12% | 14 |
| 14 (11) | Miami FL | USA | 74 | 70 | 6% | 20 |
| 15 (16) | Dublin | IRL | 81 | 72 | 13% | 15 |
| 16 (15) | Rome | ITA | 71 | 69 | 3% | 15 |
| 17 (19) | Houston TX | USA | 66 | 62 | 6% | 17 |
| 18 (20) | Brussels | BEL | 74 | 68 | 9% | 12 |
| 19 (21) | Atlanta GA | USA | 65 | 61 | 7% | 18 |
| 20 (28) | Warsaw | POL | 70 | 61 | 15% | 17 |
| 21 (22) | Melbourne | AUS | 65 | 62 | 5% | 18 |
| 22 (18) | Washington DC | USA | 62 | 63 | -2% | 12 |
| 23 (27) | Seattle WA | USA | 63 | 58 | 9% | 18 |
| 24 (25) | Milan | ITA | 64 | 60 | 7% | 18 |
| 25 (17) | Toronto ON | CAN | 61 | 63 | -3% | 13 |
It’s not just Londoners feeling the pinch. Across the UK, drivers spent an average of 62 hours in traffic last year—up by an hour compared to 2023. Among the worst-hit cities:
- Bristol: 65 hours of delays
- Leeds: 60 hours
- Manchester: 61 hours (a massive 13% increase from 54 hours in 2023)
MOST CONGESTED UK ROADS BY TOP THREE CITIES IN 2024
| Road Name | From | To | Peak Hour | 2023 Peak Minutes Lost | 2023 Hours Lost |
|---|---|---|---|---|---|
| London | |||||
| A40 WB | A320 | A406 | 5:00 PM | 17 | 68 |
| N Circular Road NB | Falloden Way | A1110 | 4:00 PM | 10 | 40 |
| M25 SB | M3 | A3 | 5:00 PM | 8 | 34 |
| Bristol | |||||
| A420 EB | Lawrence Hill Rndbt | Hollow Rd | 4:00 PM | 5 | 21 |
| Portway/A4 SB | Portway Rndbt | Bristol Gate | 5:00 PM | 5 | 21 |
| A3029/A4174 EB | A38 | A37 | 4:00 PM | 5 | 18 |
| Leeds | |||||
| A650 SB | Queens Road | All Saints Rd | 4:00 PM | 10 | 38 |
| A657/Leeds Rd WB | Cross Road | Bingley Rd | 4:00 PM | 8 | 30 |
| A65/New Road SB | Park Road | Horsforth New Rd | 4:00 PM | 7 | 26 |
Bob Pishue, Inrix’s transportation analyst, explained "While the UK did see a slight increase in congestion again this year, overall congestion has remained steady.
"Roadworks in key corridors such as M25 Wisely interchange caused considerable traffic on a main artery into the capital.
"Interestingly it was cities outside of the capital that saw the greatest increase in congestion with Manchester seeing a large increase, up 13 per cent.
"While London only had a modest increase in time lost, it still represented half of the entire country’s delay."
London dominates when it comes to traffic delays in the UK, and Inrix has a simple explanation: the city’s massive population, job density, and economic activity create the perfect storm for gridlock.
Transport for London (TfL) said "We are committed to making sure Londoners can move around the capital as safely, sustainably and efficiently as possible.
"We support the movement of everyone across London and our investment in walking, cycling and public transport is making it easier to choose sustainable ways of travelling, helping to cut congestion.
"Our network includes some of the busiest roads in the country and we continue to invest in world-leading programmes to make sure roads are used as efficiently as possible.’
Inrix pulled its findings from a variety of sources, including data collected from phones and vehicles.
So next time you’re stuck in traffic, just remember: you’re part of a £3.85 billion problem.