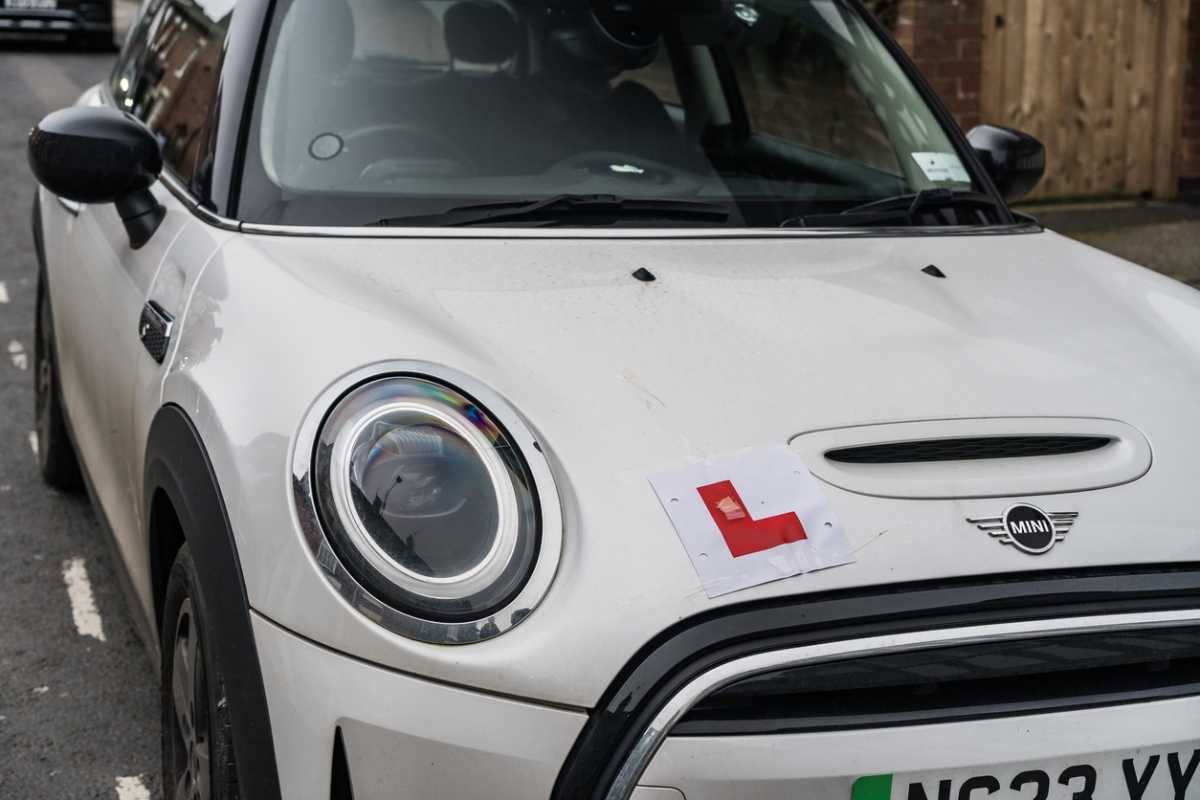
More than 100,000 car driving tests were cancelled across the UK in 2025/26, disrupting thousands of learner drivers.
Analysis of Driver and Vehicle Standards Agency (DVSA) data by learner driver insurance provider Tempcover found that examiner medical absences were responsible for the majority of cancellations.
Although cancellations fell by 16% compared with the previous year, they remain almost 36% higher than they were a decade ago.
Driving test cancellations remain high
A total of 101,423 driving tests were cancelled between April 2025 and March 2026, compared with 120,710 in 2024/25.
The latest figure is almost 36% higher than the 74,693 cancellations recorded in 2015/16.
| Year | Tests Conducted | Tests Cancellled |
| 2015/16 | 1,537,735 | 74,693 |
| 2019/20 | 1,599,566 | 152,082 |
| 2020/21 | 436,044 | 728,968 |
| 2021/22 | 1,538,314 | 119,484 |
| 2022/23 | 1,688,955 | 118,232 |
| 2024/24 | 1,945,225 | 102,125 |
| 2024/25 | 1,839,815 | 120,710 |
| 2025/26 | 1,998,621 | 101,423 |
The figures for 2020/21 reflect the significant disruption to driving tests during the COVID-19 pandemic.
Medical absences caused the most cancellations
Examiner medical absences were the leading cause of cancellations in 2025/26, accounting for 60,092 tests - around 59% of the total.
Examiner leave was the second most common reason, with 29,438 cancellations, followed by acts of nature with 11,884.
| Reason for cancellation | Cancellations |
| Medical absences | 60,092 |
| Leave | 29,438 |
| Acts of nature | 11,884 |
| Disputes | 9 |
Medical absences were therefore responsible for more than twice as many cancellations as examiner leave.
Which test centres had the highest cancellation rates?
Cancellation rates varied considerably between test centres.
Crewe recorded the highest cancellation rate in 2025/26, at 17%. Of the 6,020 tests scheduled, 1,026 were cancelled. Medical absences accounted for 923 of these.
Huntly and Skegness recorded the next-highest rates, at 15.2% and 14.8% respectively.
| Rank | Test Centre | Cancelled | Conducted | Cancellation rate |
| 1 | Crewe | 1,026 | 4,994 | 17.0% |
| 2 | Huntly | 44 | 245 | 15.2% |
| 3 | Skegness | 361 | 2,078 | 14.8% |
| 4 | Arbroath | 104 | 605 | 14.7% |
| 5 | Dundee | 565 | 3,742 | 13.1% |
| 6 | Forfar | 96 | 667 | 12.6% |
| 7 | Stirling | 387 | 2,747 | 12.3% |
| 8 | Heysham | 466 | 3,692 | 11.2% |
| 9 | Basingstoke | 619 | 5,009 | 11.0% |
| 10 | Leeds (Colton Mill) | 786 | 6,432 | 10.9% |
Where were cancellations lowest?
Lee On The Solent recorded the lowest cancellation rate, at 0.3%.
Of 8,526 scheduled tests, 24 were cancelled. Salisbury and Yeovil also recorded low cancellation rates, at 0.4% and 0.6% respectively.
The significant variation between test centres means learners can face very different levels of disruption depending on where they take their test.
What does this mean for learners?
A cancelled test can disrupt months of preparation, particularly when it happens close to the scheduled date. Learners may then need to wait for another appointment while maintaining their driving skills and confidence.
Regular practice during a delay can help learners stay prepared for their next test, whether through lessons with an instructor or private practice with an eligible supervising driver.
As Tempcover's research highlights, the number of cancellations has fallen from the previous year, but remains significantly above levels seen a decade ago.